Access Binance in Excel

Binance is the biggest cryptocurrency exchange in the world. Use this connector in Excel to access public exchange information, as well as your personal trading data.
Exchange Info
List all available trading pairs on the exchange, as well as additional trading info for each pair.
Fields
- Symbol - symbol for the trading pair, e.g. ETHBTC
- Status - trading status for the pair - PRETRADING / TRADING / POSTTRADING / ENDOFDAY / HALT / AUCTION_MATCH /BREAK.
- Base Asset - base asset that is the quantity of a symbol, e.g. ETH.
- Base Asset Precision - number of digits
- Quote Asset - quote asset that is the price of a symbol, e.g. BTC.
- Quote Asset Precision - number of digits
- Minimum Notional - minimum notional value allowed for an order on a symbol. An order's notional value is the price * quantity.
- Minimum Price - minimum price allowed.
- Maximum Price - maximum price allowed.
- Tick Size - intervals that a price / stop price can be increased/decreased by.
- Minimum Quantity - minimum quantity allowed.
- Maximum Quantity - maximum quantity allowed.
Order Book
List of open orders for specified symbol (e.g., ETHBTC)
Parameters
- Symbol (required) - symbol for the trading pair (e.g. ETHBTC)
- Limit - limit of orders to retrieve.
Recent Trades List
List most recent orders for a specified currency pair.
Parameters
- Symbol (required) - symbol for the trading pair (e.g. ETHBTC)
- Limit - limit of orders to retrieve
Aggregate Trades List
List compressed, aggregate trades. Trades that fill at the time, from the same order, with the same price will have the quantity aggregated.
Parameters
- Symbol (required) - symbol for the trading pair (e.g. ETHBTC)
- Limit - limit of orders to retrieve
24 hour ticker price change statistics for symbol
24 hour price change statistics for selected symbol.
Parameters
- Symbol (required) - symbol for the trading pair (e.g. ETHBTC)
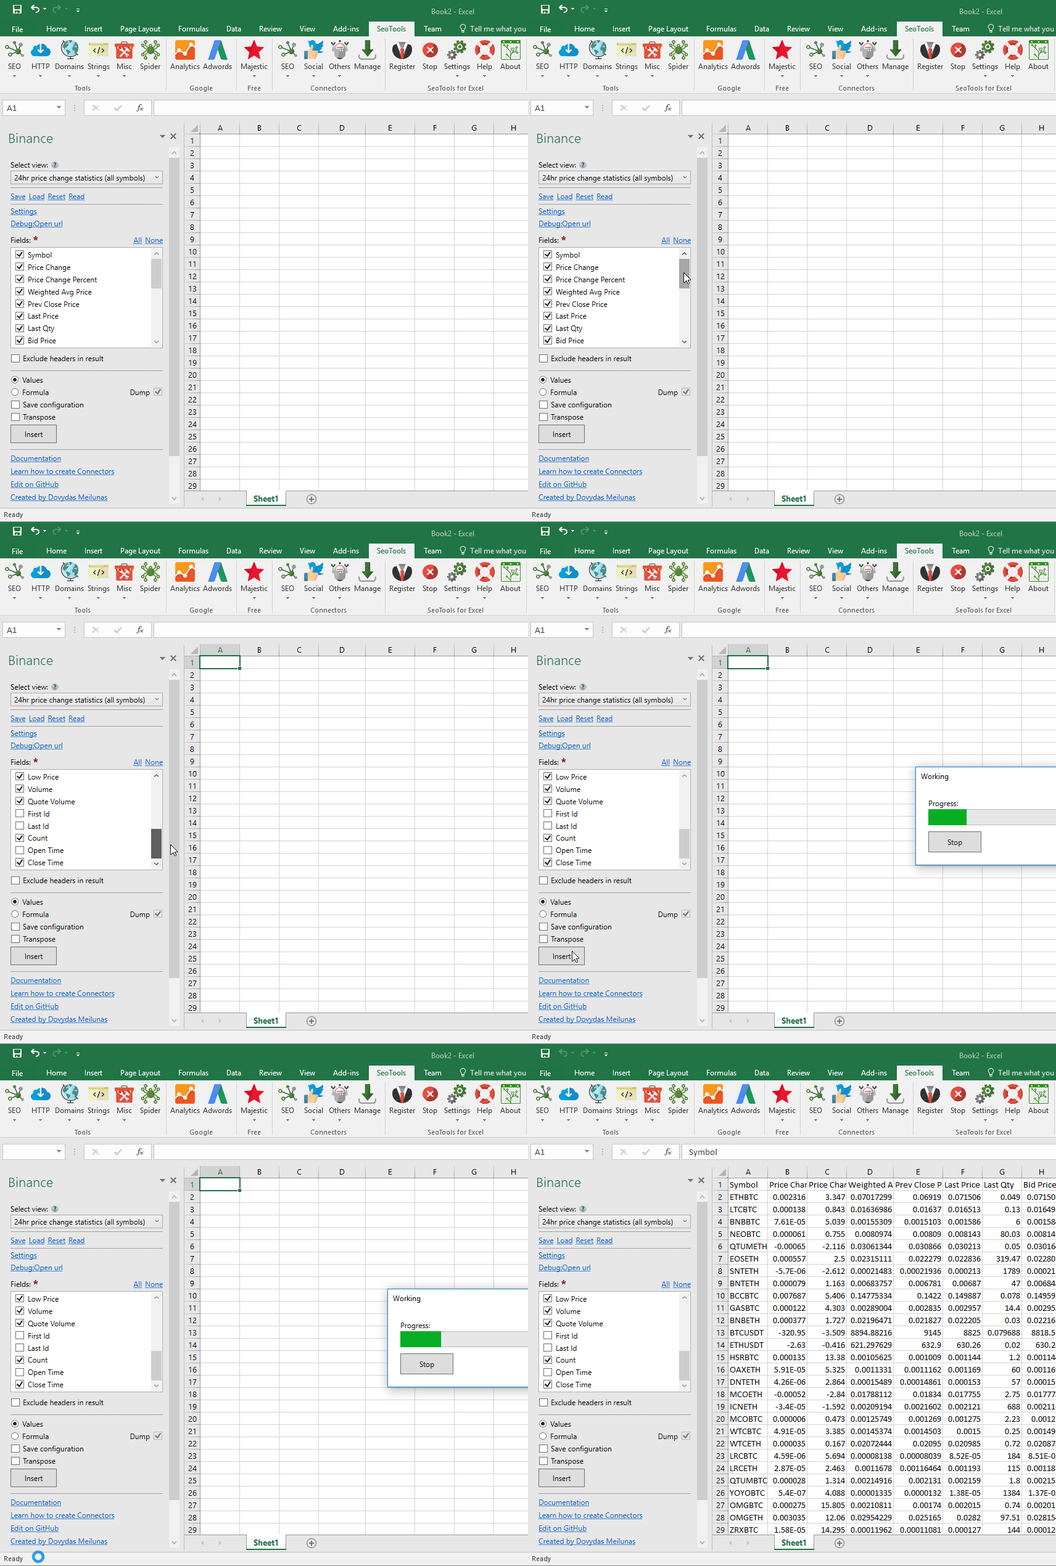
24 hour ticker price change statistics (all symbols)
Same as above, but for for all available symbols.
Candlestick Data
Trading data for candlestick/k-line charts.
Parameters
- Symbol - Trading pair symbol (e.g. ETHBTC)
Generating candlestick charts with retrieved data
Follow these steps to generate candlestick charts with Excel:
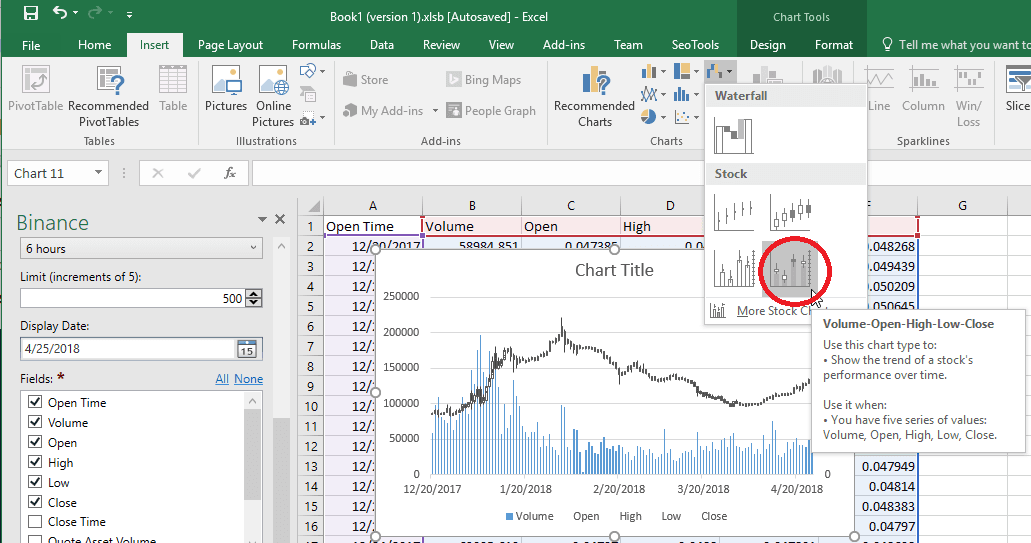
- Select Open time, Volume, High, Low and Close fields. Insert the data.
- Go to Insert tab in Excel, and click the Insert Waterfall or Stock Chart. Choose Volume-Open-High-Low-Close chart.

Open orders (user data)
Retrieves a list of user's open orders.
This connector requires API key and secret to be entered.
Parameters
- Symbol - Trading pair symbol (e.g. ETHBTC)
All orders (user data)
Retrieves a list of user's orders (up to 500) - active, canceled, or filled.
This connector requires API key and secret to be entered.
Parameters
- Symbol (required) - Trading pair symbol (e.g. ETHBTC)
- Limit (requiredd) - Maximum number of orders to retrieve (5-500)
Account information (user data)
Retrieves user's account information.
This connector requires API key and secret to be entered.
Fields
- Maker Commision
- Taker Commission
- Buyer Commision
- Seller Commision
- Can Trade
- Can Withdraw
- Can Deposit
Currency Balances (User data)
Lists balances for all user's currencies.
This connector requires API key and secret to be entered.
Fields
- Time - Time when balance was checked
- Asset - Symbol for the asset (e.g. BTC)
- Free - Amount available to trade.
- Locked - Amount locked (unavailable to trade).
Access
Add from Manager
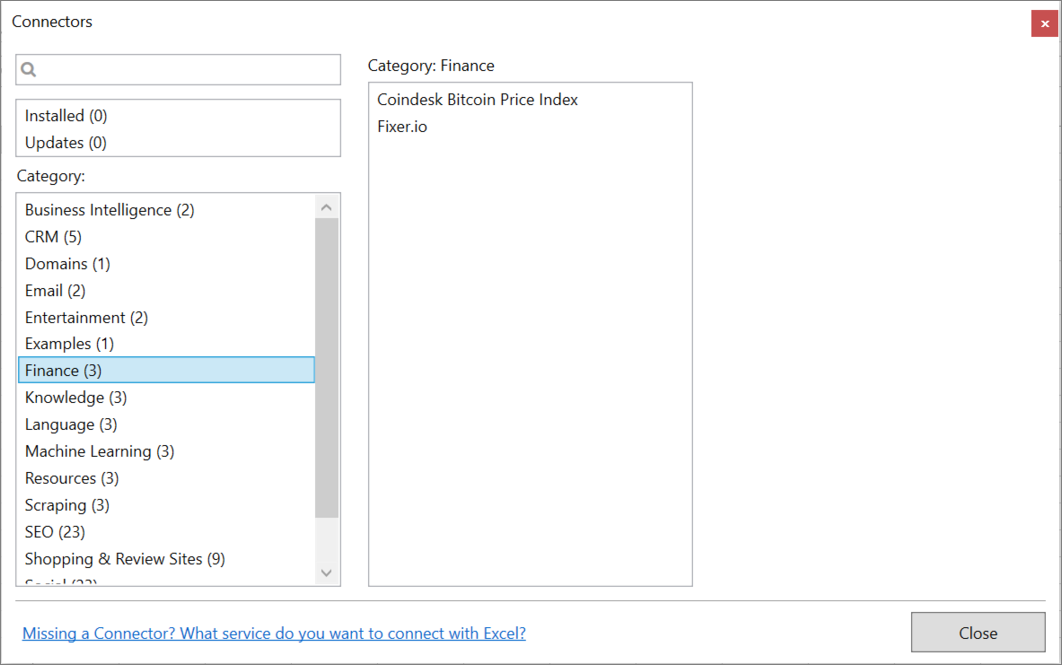
The Disqus Connector is available in the Connectors Manager in the top ribbon:

Head over to the Finance Category and install Binance:

Get API keys
To use the Connector you need a Binance API Key. You can create your API Key and Secret in your Account settings.
Contribute
This connector suite is open-sourced on GitHub.
Get help with this function in the community →