Access Mixpanel in Excel
- Event Statistics - Get unique, total, or average data for a set of events. Filter by:
- Date intervals
- Granularity
- Event Property Statistics - Get unique, total, or average data for of a single event and property. Filter by:
- Date intervals
- Granularity
- Values
- Event Top Properties - Get the top property names for an event.
- Common Events - Get a list of the most common events over the last 31 days.
- Top Events Today - Get the top events for today, with their counts and the normalized percent change from yesterday.
- Properties Top Values - Get the top values for a property.
Contribute
This connector suite is open-sourced on GitHub.
Access
Add from Manager
The Mixpanel Connector is available in the Connectors Manager in the top ribbon:
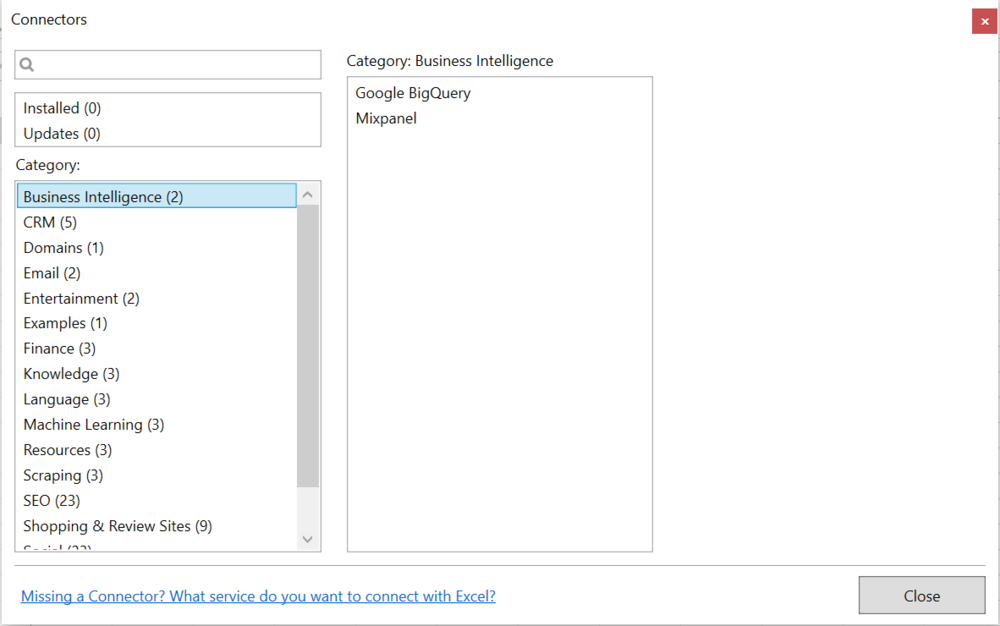
Head over to the Business Intelligence Category and install Mixpanel:
Get API keys
To use the Connector you need a MixPanel API Secret Key
Get help with this function in the community →