Access Flurry Analytics in Excel
The Flurry Analytics provides you with the tools and resources you need to gain a deep level of understanding about your users’ behavior in your apps.
Table Metrics
Chose one of the following data-sets:
- App Usage
- Sessions
- Active Devices & Users
- New Devices
- Time Spent
- Average Time per Device & Session
- Median Time per Session
- App Events
- Occurrences
- Active & New Devices
- Event Duration
- Average Event Duration
- Average Event Duration per Device
- Real-time
- Sessions
- Active Devices
- Audience
- Sessions
- Active & New Devices
- Time Spent
- Average Time per Device & Session
- Technical
- Sessions
- Active & New Devices
- Time Spent
- Average Time per Device & Session
- User Acquisition
- Campaign Clicks
- Campaign Conversions & Rate
- Revenue
- Purchases
- Purchase Quantity
- Purchase Devices
- Purchase Users
- Revenue Original Currency
- Revenue USD & EUR
Table Dimensions
Break down your results with one or more of the following dimensions:
- General
- Date
- Company Name
- App Name & Version
- Category
- Language, Country & Region
- Audience
- City
- Geo Area
- Age Estimate
- Gender Estimate
- Technical
- Carrier
- Device Model
- OS Version
- Platform
- User Acquisition
- Campaign Name
- Channel Name
- Revenue
- Product Type
- Transaction Type & Outcome
Filters
Dimension attribute filters that are combined (as AND) to reduce output to match your criteria. id and name are available for all dimensions. Operators: in, notin, contains, startsWith
<dimension1>|<attribute-operator[value(s)]>
Metrics filters reduces result to match the metrics criteria specified. you can combine multiple metrics criteria. Operators available: equal(eq), greaterThan(gt), lessThan(lt) and their not versions
<metric-operator[value(s)]>
Filter examples
Country must be either Canada or Mexico and app version must be equal to 2.3
country|name-in[‘Canada’,’Mexico’] ,appVersion|name-in[‘2.3’]
Sessions must be greater than 1000 and active devices must be greater than 200:
sessions-gt[1000],activeDevices-gt[200]
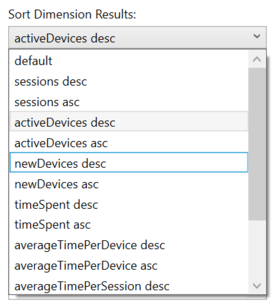
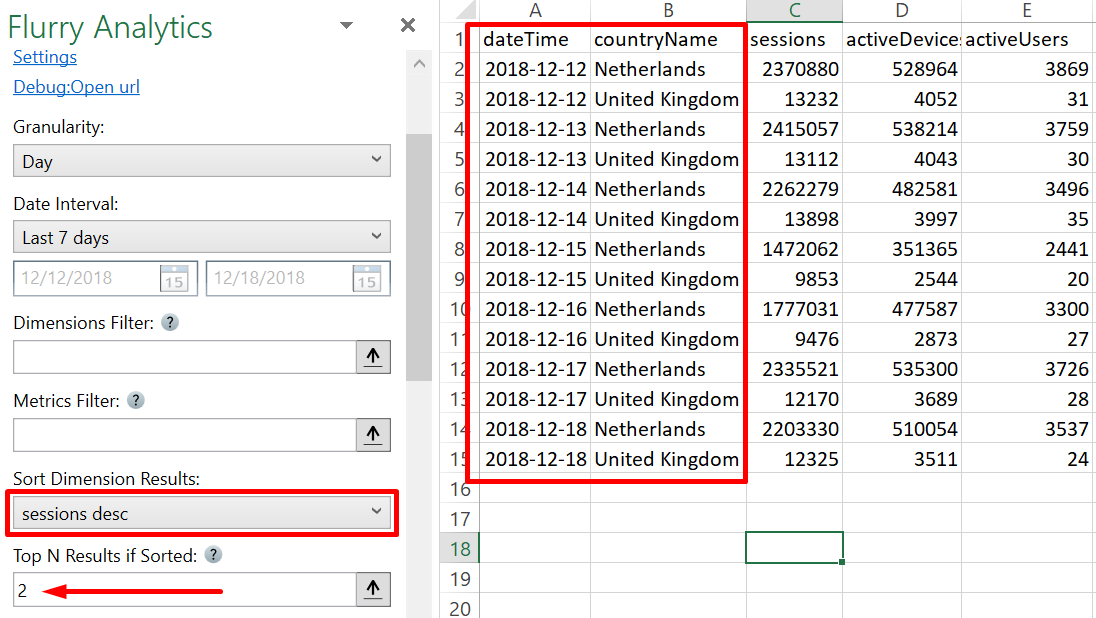
Sorting
Specify one or more metrics to sort results by. If order is not specified, then it defaults to descending.
Top N Results
Reduces result to match the number specified for this parameter. If this parameter is used, then you must also use sort to indicate metric and order by which top n must be calculated.
Access
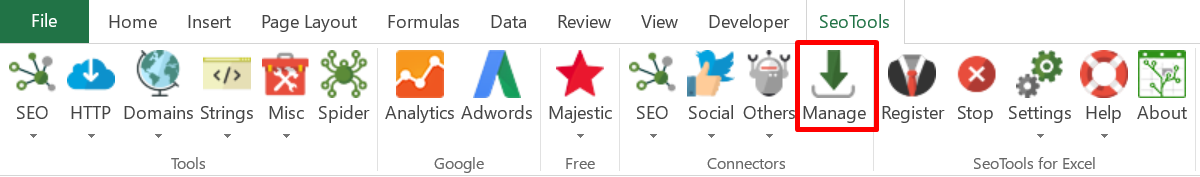
Add from Manager
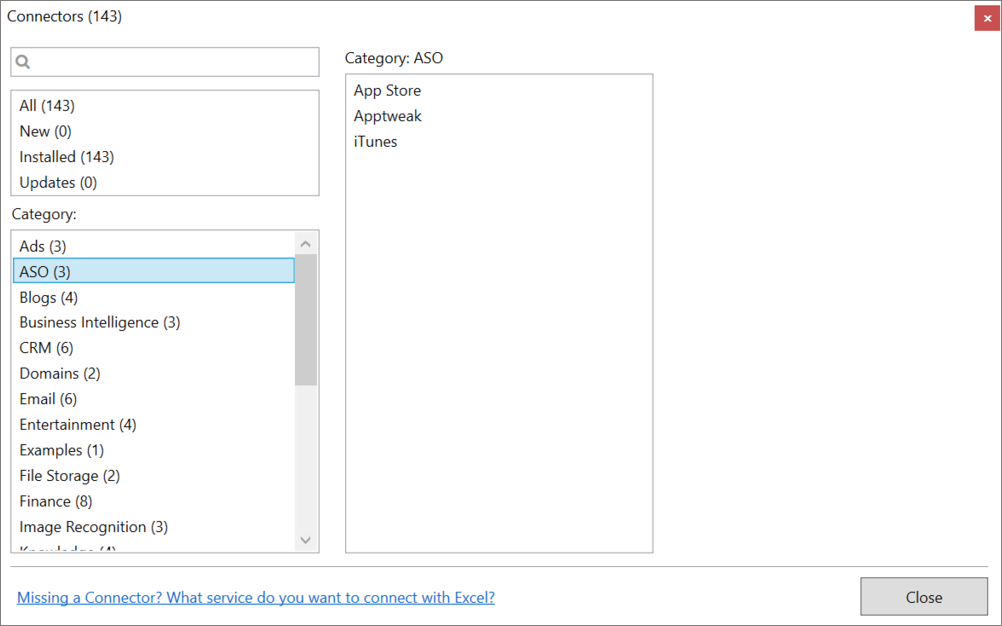
The Flurry Analytics Connector is available in the Connectors Manager in the top ribbon:
Head over to the ASO Category and install Flurry Analytics:
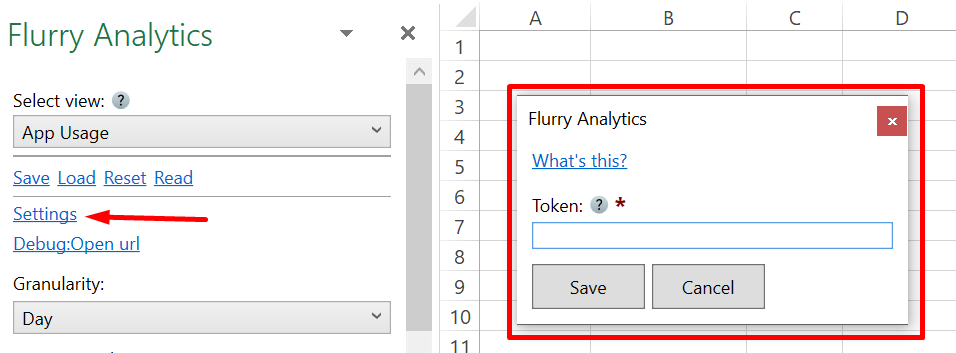
Get Token
To use the Flurry Analytics Connector you need a token. We recommend following this official guide.
Copy the Token and paste the key in the Flurry Analytics task-pane inside Seotools:
Contribute
This connector suite is open-sourced on GitHub.
Get help with this function in the community →